Disclaimer: The following case study is illustrative of the work completed at Northrop Grumman. They outline how the goals and job of a UX Researcher have been accomplished. The process, results, and outcomes are all based on real situations; however, the scenario, data, and application have all been adjusted to be publicly consumable.
End to End
Scenario:
Thunder LLC has been contacted by Hospital Zep with a request to update Hospital Zep’s Oncology Wing. Thunder LLC has accepted this request and has begun work on the plans for the update. The update will be known as Solution Storm Cloud. Within Solution Storm Cloud are several projects, such as Project Rain Drop, which encompasses the effort to update and create new nurse interfaces. The initial research of Project Rain Drop, identified the following critical updates;
Improve nurse-to-nurse communication during shift changeover
Improve situational awareness of medication stock
Enable simplified scheduling of patient procedures.
These updates would be implemented while retaining the following capabilities.
View patient information pages
View fellow nurse schedules
A contact list separated by internal and external numbers
These tasks for Project Rain Drop were broken up among the UX Team, with each member focusing on a specific update. However, those team members will work collaboratively to ensure consistency throughout the interfaces across Project Rain Drop.
Solution Storm Cloud is being developed in an Agile environment where multiple stakeholders are working in tandem. This includes the software developers who will be creating the code or other UX team members who are focusing on other aspects of Project Rain Drop. In addition, there are other teams internal to Thunder LLC who have their own requirements for Solution Storm Cloud. These requirements may be based on medical regulations, security, or health and safety. Final stakeholders include Hospital Zep, who will be buying Solution Storm Cloud, and the nurses who will be using portions like Project Rain Drop in their day-to-day operations.
Case Study 1: Establishing Icon Visuals and Usage
Background:
As Project Rain Drop progressed, the need to improve nurse-to-nurse communication during shift changeover was broken down into its components to be researched. One such component was patient medication. It was found that a significant amount of time was spent communicating medication statuses of the various patients such as:
A patient has a new medication
A patient needs medication administered
To limit the time spent on this communication, a Patient Overview Portal was designed. This Overview Portal would allow nurses to see a roll-up of all their patients in a single page with the ability to pull up a single patient’s page, like the ones the nurses currently use. This roll-up would consist of a display for each patient with different icons being used to communicating the patient’s various statuses.
Objective:
The object of this research is to identify which of the icons best conveys the needed information. This will be done through interviews and A/B testing methodologies. The interviews will focus on understanding what the icons are communicating to the nurses. The A/B testing will focus on which icon/icon group best provides the needed information within the environment. The data being focused on is time to complete and correctness. This data will identify which icon best communicates the individual status and any potential dependencies among the icons. One of the limitations being taken into consideration for this study is total time. The users will be tested during normal work hours, limiting the time they can be participants in a user session.
Materials
Icons: A patient has a new medication (Medication)

Icon 1

Icon 2

Icon 3
Icons: A patient needs medication administered (Timing)

Icon A

Icon B
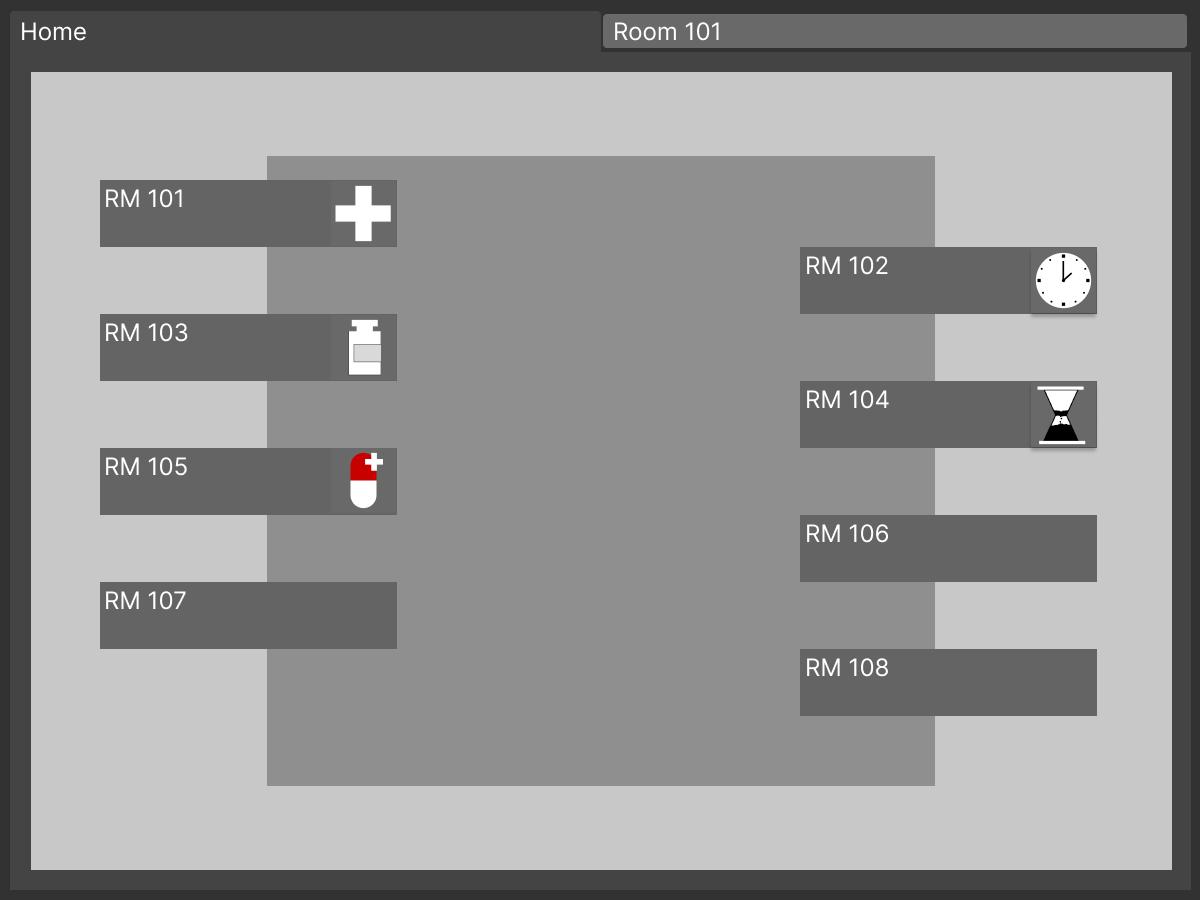
Patient Overview Portal with Icons
Methods:
Interview
Conduct an initial interview with the users
Ask the user to walk through the display, explaining what they notice and what they believe the different functionalities are
Provide the user with images of icons asking them to explain what they think each one means
Data Type: qualitative Nominal data
Total time: approximately 15 minutes
A/B Testing
(Quantitative data)
Independent variables:
New Medication Icon (Icon 1, Icon 2, Icon 3, No Icon)
3 x 2 x 3
3 Medication icon options by 2 scenarios by 3 time icon options
2 questions being asked with each variable configuration for a total of 12 questions per icon, and 36 questions pertaining to the New Medication icon
Time to Give Medication Icon (Icon A, Icon B, No Icon)
2 x 2 x 4
2 time icon options by 2 scenarios by 4 medication icon options
2 questions being asked for each variable configuration for a total of 16 questions being asked per icon, and 32 questions pertaining to the Time Icon
UI Noise (High or Low)
Metrics being gathered:
Time to complete the task (Continuous data)
Correctness (Discrete data)
Test Set-up:
Initial 5 questions – practice questions
Allows the user to see the icon in the UI environment
Provides user time to adjust to the tool being used
Total time: approximately 1 hour
Data and Analysis:
Analysis Steps
Organize data based on the variables being tested, metrics being reviewed and the questions being asked
Review the data for outliers using IQR, Z-score, or histogram
Discuss identified outliers with the facilitator to determine if there was a reason for the data point being an outlier (such as the user was asking a question or the session was interrupted) or if the data was accurate
Remove outliers and re-organize data
Conduct appropriate statistical tests within the limitations of the statistical analysis tools available. In this instance the tool being used was excel.
Correctness was based on assigning a 1 to all correct questions and a 0 to all incorrect questions and averaging the answers
For the timing data F-Tests and T-Tests were used to compare the necessary data points
Review the results of the statistical tests to determine the outcome, comparing the various variables and reviewing for any data that may indicate confounding variables or missed outliers.
Results and Observations:
Results and observations were separated into three groups: Qualitative, Quantitative Continuous, and Quantitative Discrete. A total of six users were available to be interviewed and walk through the testing session.
Qualitative:
Of the Medication Icons, icon 2 was identified to most closely align to the user’s mental modal of communication that a new medication was prescribed to a patient. A takeaway was the users associated the pill with “medication” and the plus sign with “addition”. Users also identified the plus sign with “addition” but not necessarily medication. Finally, users identified the vial as “medication”, but not necessarily with “addition”
Of the Timing Icons, icon B was identified to most closely align to the user’s mental modal of needing to give patients medication soon. They had mentioned the clock reminded them of “time” and “time frame”. Users identified icon A as not aligning with their mental model, commenting that the hourglass reminded them of a “deadline”. Users stated providing medication to a patient does not always have to be done at the exact time due the potential of other tasking taking priority. Two of the users made the comment that the hourglass would be a good way to show a task that does need to happen at a specific time needs to occur soon. This was mentioned in relation to specific medications or patient prep for specific treatments.
Quantitative Data:
All the data was first organized into three groups based on the independent variables identified earlier. These groups where then broken out further based being looked at.
Continuous:
When comparing the high noise to the low noise data, it was found users took longer to identify the icon being asked about in the high noise environment which aligned with the expected outcome.
When comparing the medication icons there were slight differences in time, but there were no differences high enough to take note
When comparing time icons there was again a slight difference in the timing but nothing over a p-value of 0.5
The above trends continued throughout the data. There was an overarching trend of icon 1 always being slightly faster than the other icons, regardless of the situation it was in.
When looking through the time icon data, there was very little distinction and not discernable trend between icons A and B.
Qualitative Discrete:
When comparing correctness of medication icons, it was found that icon 2 has a lower overall percent correct compared to the other Medication Icons, and Icon 1 had the highest percentage correct/
There was a difference in percentage correct when comparing the high and low noise environments, with the high noise environment having a slightly lower percentage correct than the low noise.
Icon B showed to have a lower overall percentage correct compared to Icon A
It was found that the combination of Icon B with Icon 2 had a noticeably low percentage correct. This instance was exasperated in the high noise environment.
Conclusion:
The recommendation provided after this event was to move forward with Icon 1 and Icon B. This decision was based on user feedback during the interview, the timing data results, and correctness results. Users identified icon A as not aligning with their mental model, driving the use of Icon B. Icon 2 and Icon B showed to cause confusion when the two icons were used on the same screen, preventing Icon 2 from being used. Reviewing the data, Icon 1 had a trend of being the fasted timing data, in addition to a higher percentage of correctness. Additionally, the users identified the “plus” as aligning with their mental modal of adding a new medication. Finally, reviewing the two designs, icon 1 is the most different from icon B due to the shape of the icon. It is believed the similar shapes of icon 2 and icon B could be what caused users to select the wrong icon during the testing. As more icons are added to this screen, the option to potentially add a “pill” image to icon 1 is being noted, in case there is a need to differentiate icons. This potentially option is based on keeping the current differentiation of shaped between icon 1 and icon B while adding an aspect the users identified as helping to better align the icon with their mental model.